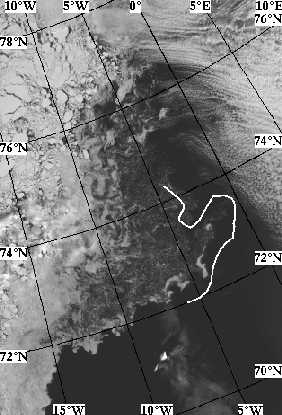
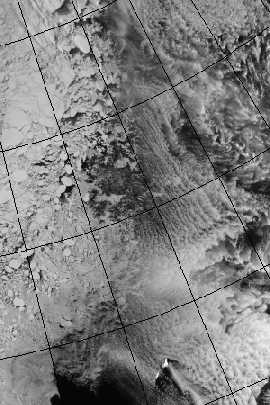
The ice cover in the Odden region reached a minimum on April 20, 1996, and we have reasonably cloud free images from April 26 (Figure 31) which show the rather scattered ice field on that day. A more detailed analysis of the ERS-1 SAR images from April 23 (Figure 32) also reveals that the icefield is scattered and that most of the remaining ice is forming long bands with values between -9 and -6 dB. The backscatter coefficient of the areas between the ice bands ( values between -13 and -9 dB) is in between what would be expected from the open ocean and the typical value for frazil ice. This indicates that ice is present in the area, perhaps in the form of individual growlers.
The subsequent AVHRR images (Figure 31) show the gradual expansion of the almost total ice cover that eventually on May 8 reached a maximum of 178.000 square kilometres. The SAR image of May 6 shows the much more consolidated ice field in approximately the same area as the April 23 image. Backscatter coefficients in the May 6 (Figure 32) image ( values between -11 and -9 dB) are close to the ones in the early April images from the newly formed ice at that time (Figure 29).
The Danish Meteorological Institute and the Technical University of Denmark provided operational ice mapping for the Valdivia cruise based on NOAA AVHRR images (DMI) and SSM/I passive microwave observations (DTU). Two examples of DMI's interpretation of NOAA AVHRR images are shown in Figure 33. It is seen that the ice observer at DMI interpreted the NOAA AVHRR image of the Odden area as 2-4 tenths of ice during the early 'Valdivia' encounter with the Odden. This is consistent with the SAR images that we have used in this study (Figure 32) and with the SSM/I observations that showed that the ice cover decreased rapidly during the period from April 5 to April 20.
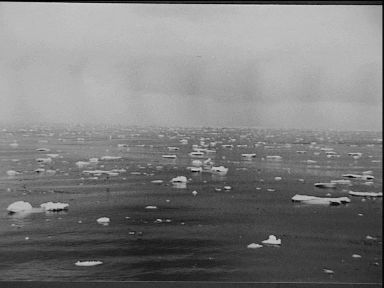
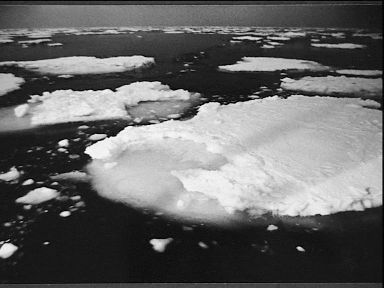
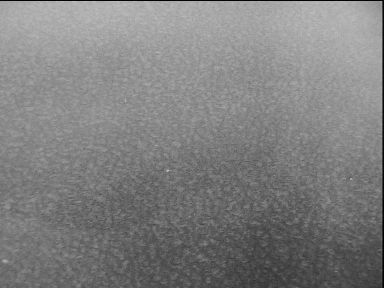
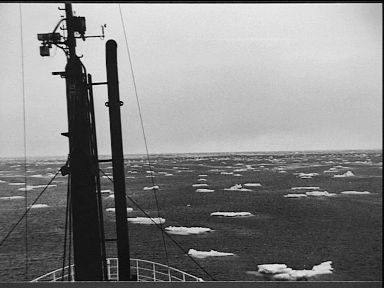
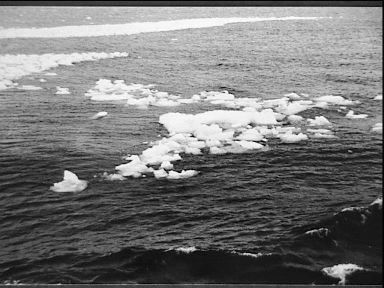
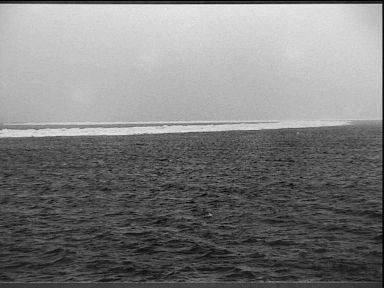
The German research vessel 'Valdivia' visited the Greenland Sea in April-May 1996 (Backhaus, 1996) and Jan Backhaus who was chief scientist made ice observations in the form of observations of the ice edge (see Figure 31a) and in the form of a number of photographs taken from the ship. Selected photographs are shown below in Figure 34.
Figure 34a+b show growlers of multi-year ice at the southern boundary of the Odden region, while 34c shows the only observation of small pancakes during the entire cruise. This was closer to the tip of Odden and in the same area as the growlers of Figure 34d. The two last photos are from the northern side of Odden, and again shows bands of growlers.
Combining the observations by Jan Backhaus with the satellite image analysis presented here, it is clear that the ice present in Odden around April 20-26 was the ice that had survived the previous melting period, i.e. the thickest parts of the ice. Whether this ice was locally grown or advected into the area cannot be determined from our analysis. Jan Backhaus's observations strongly suggestes that the ice present at this stage is multi-year floes disintegrated into growlers and blown into bands by the prevailing wind conditions. The bands are clearly visible in several of the satellite images, in particular the SAR image of April 23 and the AVHRR image of April 26.
The only documented earlier case of substantial older first-year or
multi-year ice being dominant within the Odden ice tongue also occured
late in the season. In 1987 an ice tongue existed at the end of May and
its thickness was profiled by a British submarine (Wadhams, 1992). The
results showed mean drafts of 0.33, 0.62, 0.94 and 1.05 m from 50 km track
sections within the tongue in the region 72-74N, and a thickness distribution
with maximum drafts of 7-8 m and a negative exponential distribution of
ice draft. The nature of the ice thickness distribution indicates the presence
of old, ridged floes which had drifted from the Arctic Basin via the East
Greenland Current, although the low mean drafts and low maximum ridge depth
indicate that these floes were in a state of advanced melt. Unpublished
X-band airborne SAR imagery, which shows small but thick floes occupying
the region, supports these conclusions.
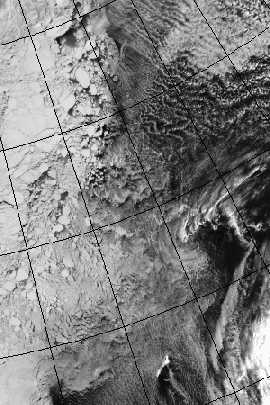

Figure 31. Near infrared NOAA AVHRR images showing the development
of ice in the Odden/Nordbukta area during the period April 26 (upper left),
May 1 (uppper right), May 5 (lower left) and May 8 (lower right), 1996.
The ice edge observed from the Valdivia during April 21-24 is drawn in
the April 26 image.
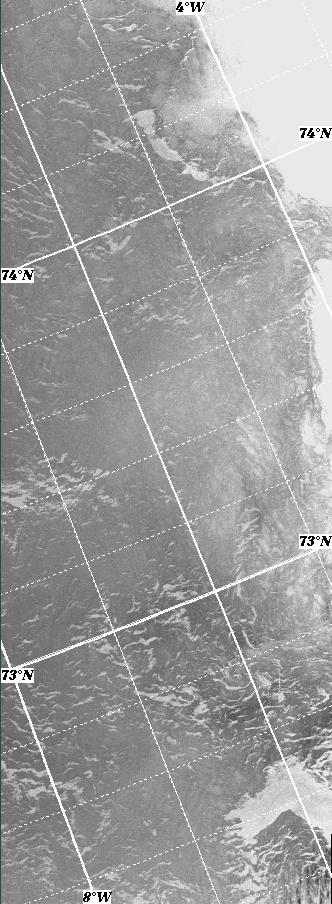

Figure 32. ERS-1 SAR images from April 23 (left) and May 6 (right) showing approximately the same area before and after/during the advance of ice in early May.
Figure 33. Operational ice chart from the Danish Meteorological Institute. The chart show the ice observer's interpretation of the NOAA AVHRR image from April 25, 1996.