For the first time since 1981, ice was present in the Odden area through
July and into August. This very unusual development was studied by means
of satellite observations from the NOAA-AVHRR supplemented by the ERS-1
SAR.
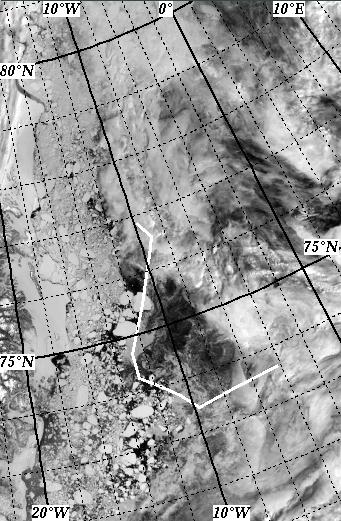
Figure 35 shows NOAA AVHRR images from June 1996. They confirm the presence
of ice in the Odden area at this late stage of the season, and from sequential
images during May to July, we have tracked a number of floes. The trajectory
of one of the largest is drawn on the Figure. This floe is approximately
25x25 kilometres in size, and at an estimated thickness of 3 metres which
is typical of multi-year ice floes found in this area at this time of the
year, it alone carries 1.9 billion m3 of fresh water into the
Greenland Sea.
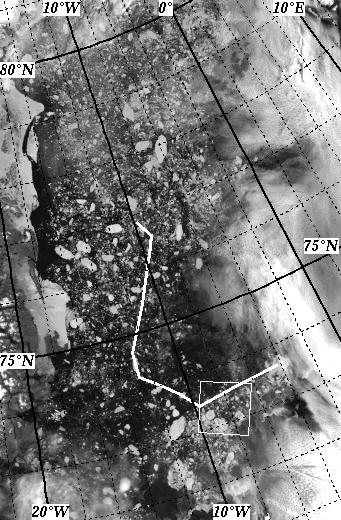
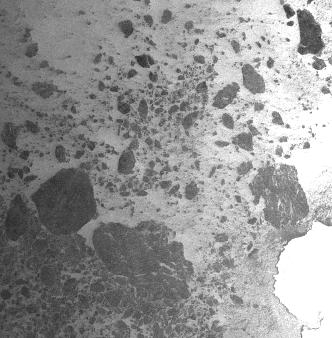
Figure 36 shows a NOAA AVHRR image from July 24, and an ERS-2 SAR image from July 25. It is seen that the Odden at this stage consists of a number of large multi-year floes in a stage of surface melt.
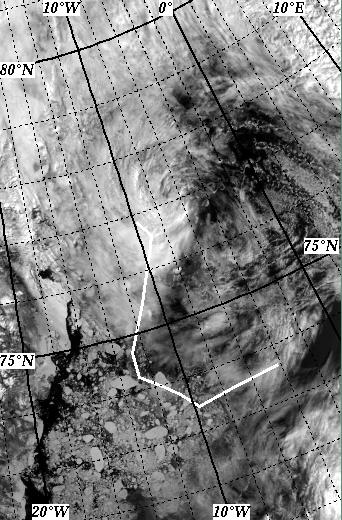
Figure 37 shows the cruise track of the 'James Clark Ross' during the
tracer release cruise of the ESOP-2 project (Andrew Watson, 1997). The
ship encountered ice on several occasions during the early part of the
voyage and eventually had to circumvent the summer Odden ice feature. On
July 25 the ship actually encountered the huge floe that had come out from
the EGC all the way to the tip of the Odden at that time.
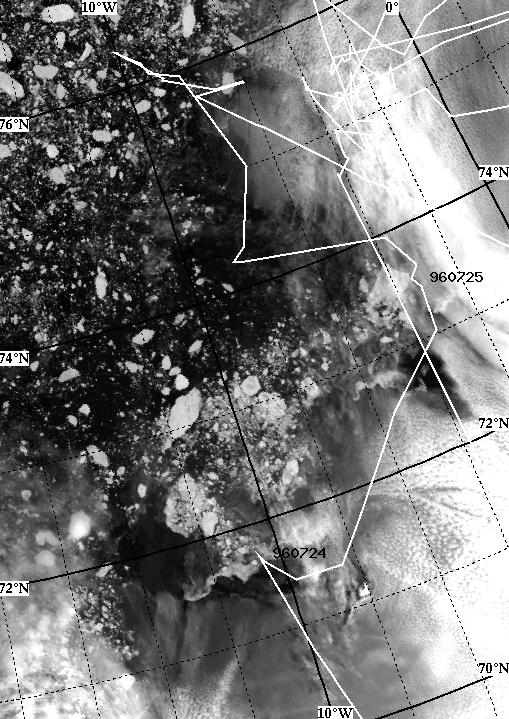
Figure 37. NOAA AVHRR image of July 24, 1996 with the track of the 'James Clark Ross' ESOP-2 tracer release cruise drawn in white. The ship first tried to pass through the ice on July 24 west of Jan Mayen, after some hours decided it would be better to circumvent the Odden, and rounded the tip of Odden on July 25.
Figure 38 shows a sea surface temperature map created from thermal infrared images from the NOAA AVHRR instrument. The image is a composite of cloud free areas from images during the period August 18 to August 23, 1996.
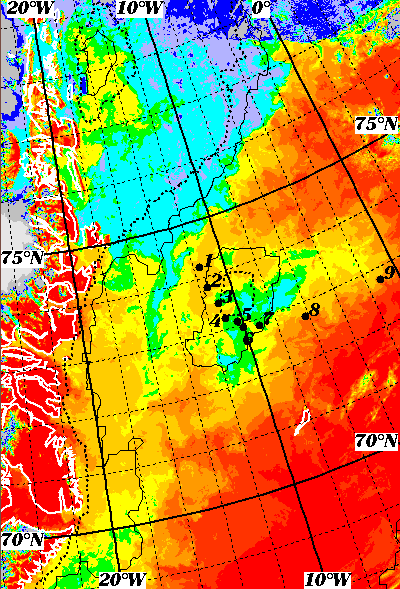
Figure 38. Maximum temperature composite NOAA AVHRR thermal infrared image of the Greenland Sea, August 17-23, 1996. Cyan (light blue) colour is the coldest, followed by green, yellow, orange, red and purple. Note the area of cyan+green north of Jan Mayen. The contours are 10% and 30% ice concentration from the SSM/I image of August 10, just before the ice disappeared 10 days before.
During the period September 1-4 1996 the region in which the last island of Odden ice had been seen (Figure 38) was crossed by a British submarine, aboard which the Dr. P. Wadhams was guest scientist. All ice had disappeared from the area of the island. The main East Greenland ice edge was crossed at 7429'N, 1145'W, and southward of this point only very occasional ice cakes were identified on sidescan sonar for a further 16 n.ml.
Within the region formerly occupied by the Odden a programme of nine XBT (expendable bathythermographs) and three XSV (expendable sound velocity) launches was carried out, together with five excursions by the boat to periscope depth in which on-board temperature and conductivity sensors were used to give a (T,S) profile of the near surface conditions.
The XBT data revealed the presence of a thin surface layer, about 20-30
m thick, which was substantially warmer than the underlying water. This
is suggestive of a thin stable layer of meltwater which has not yet mixed
down into the water column (possible due to calm conditions) and which
has been absorbing solar radiation within a limited thickness range and
thus warming up. Table 3 gives some details of the XBT programme. It can
be seen that the coldest surface water was at station 6, which lies near
the centre of the last surviving patch of ice.
|
|
|
|
|
|
|
|
|
|
|
|
|
|
|
|
|
|
|
|
|
|
|
|
|
|
|
|
|
|
|
|
|
|
|
|
|
|
|
|
|
|
|
|
|
|
|
|
|
|
|
|
|
|
|
|
|
|
|
|
|
|
|
|
|
|
|
|
|
|
Table 3. XBT results from the Odden region, September 2-3 1996.
The results from the depth excursions more clearly demonstrate the fact that this layer is indeed composed of meltwater, as they show the very low salinities that occur at the surface. In these cases the surface temperature layer was always less than 20 m deep and surface salinities were as low as 31.3 psu. Figure 39 shows the results. In each of the five cases the data are shown only down to 50 m, and the rising and sinking records have been averaged since these differed, due to a time lag in the recording system or to a lag in the water flow through the sensor.
The results agree with the XBT data in showing a thin warm layer at the surface (Figure 39a). Most spectacular, however, are the salinity profiles (Figure 39b) which show that this thin layer, only some 15 meter thick, has salinities as low as 31.3 psu. In all cases except station 5 the surface salinity was less than 32 psu.
By analysing the thickness and magnitude of the surface salinity deficit we can estimate the thickness of ice which must have melted to create this layer. The average result for the 5 stations is 1.4 meter of water equivalent. Assuming typical values for ice and water density (910 and 1025 kg m-3) and that the melting sea ice had some remnant salinity (say 4 psu as a weighted average for first- and multi-year) we obtain the final result that 1.8 m of sea ice must have melted to create the salinity profiles of Figure 39b. This is a very reasonable result, since it agrees with the submarine data of Wadhams (1992) for the thickness of ice at this latitude in 1987, when a late season Odden of polar ice was seen. This reinforces our conclusion that the late season Odden of 1996 was composed of Polar (first- and multi-year) ice originating from the East Greenland Current, and that by the time it reached the latitude of Odden it had already partially melted so as to have a remaining mean thickness of some 1.8 m