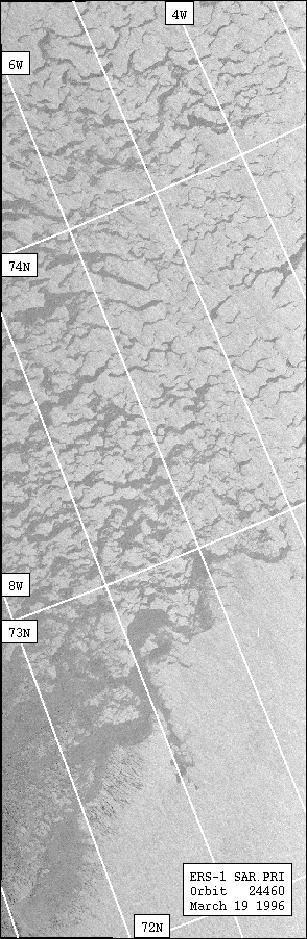
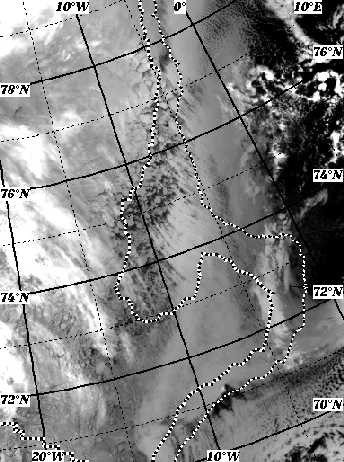
The first major advance of Odden took place beginning on March 24 and peaking April 3 (Figure 2). Figure 28 shows two ERS-1 SAR mosaics from the ice edge, geographically adjacent to one another but collected 10 days apart: a. March 19, before the ice advance, and b. March 29 during the ice advance. The brighter image on the left indicates the generally higher backscatter results obtained on March 19.
In Figure 28 a, the dark areas, values approximately -8dB, are most likely bands of frazil ice or thin pancake ice without raised edges. All the bright areas represent relatively open water, with values ranging from -5dB on the left side (far range) of the image to -3.5dB on the right side (near range). At the bottom left of the image there are streaks of ice with values not less than -12dB, indicating either pancake ice or a pancake/frazil mix. At 73N the ice limit is at 5W.
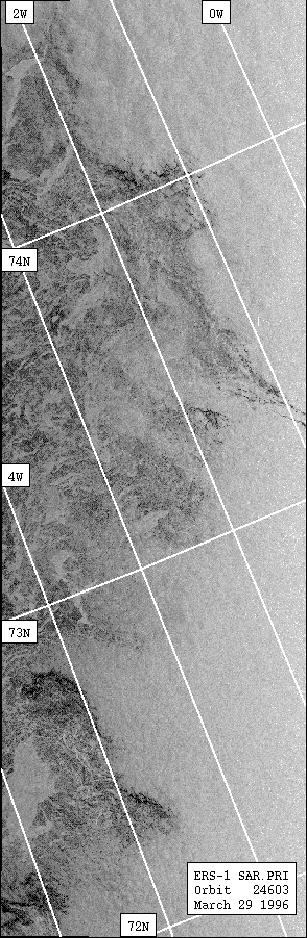
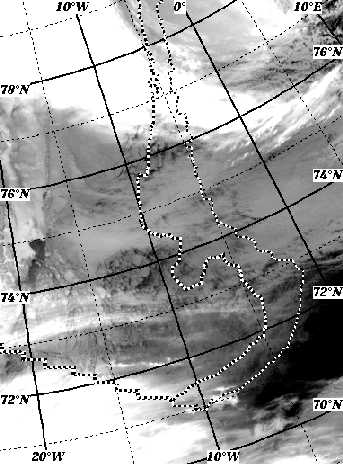
In contrast to Figure 28 a, the backscatter values for March 29 in Figure 28 b are once again low and indicate that the ice field has migrated approximately 2 east, consistent with the expanding of the Odden. The streaks of grey on the left of the image, with values approximately -9dB, once again probably bands of pancake ice. However, they are interspersed, throughout the length of the image, with very dark areas, where the values are typically below -20dB. This indicates extensive new ice growth in the form of frazil ice. The continuous grey on the right of the image is open water, with values extending from about -10dB on the left side of the image to -4dB on the right.
In conclusion, some pancake ice may have advected eastwards between March 19 and 29, however the images from March 29 show extensive new ice growth.
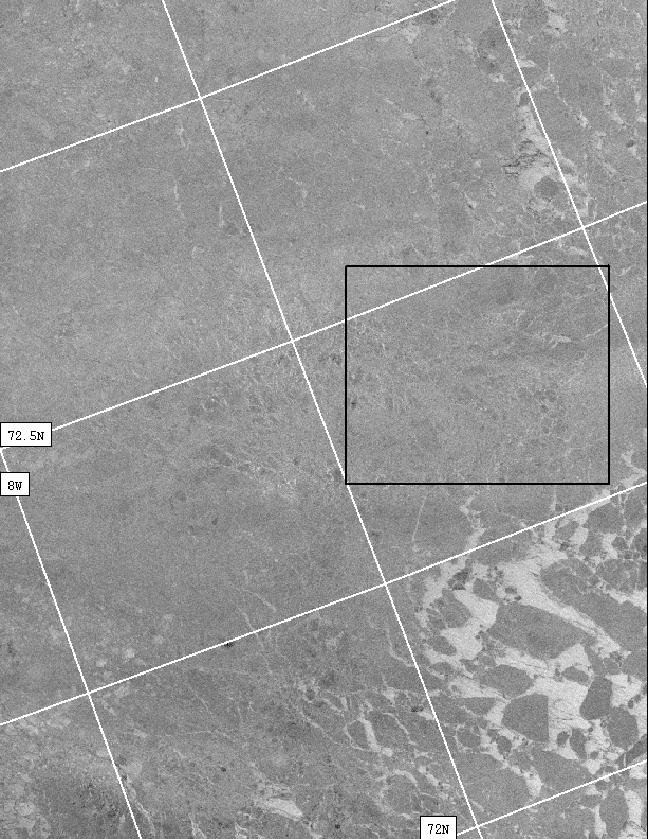
Figure 29 shows three SAR images collected from the same region of the Odden, on a. April 1, when Odden was still growing, b. April 4, the day after Odden peaked, and c. April 7, when Odden had begun to recede. The boxes within each image represent approximately the same geographical area, and the backscatter results are summarized in Table 2. On April 1 new ice growth was still taking place, thus although the outlined box contains mainly consolidated pancake ice, the minimum value of -22.1dB probably indicates that there is some frazil ice present. In contrast, on April 4 and 7 the mean backscatter is -8.2dB for both days, a slight increase possibly due to lack of frazil ice and rougher pancake ice surfaces. Rougher ice surfaces may explain the increase in maximum values from -5.5dB on April 1 to -2.6dB for April 4 and 7. Whereas the low minimum value of -22.1dB for April 1 is due to the presence of frazil ice, the image for April 7, Figure 29 c, indicates that the low minimum of -20.7dB is due to open water in calm wind conditions.
A comparison of Figure 29 a with the SSM/I data for April 1 shows that the image was collected at the ice edge. Thus the high values from the bright areas top and bottom right of approx. -4dB indicate open water in rough wind conditions. Figure 29 b is further away from the ice edge but contains similarly bright regions also with values close to minus 4dB, thus indicating relatively large leads. Figure 29 b is also the only one of the three images to show extensive floes. Figure 29 c also contains extensive but much smaller leads, giving values as low as -20dB.
In summary, the images in Figure 29 indicate that some frazil ice was
formed on April 1, not on April 4 or 7. The values for each day suggest
that April 1 and 4 were windy but that April 7 was calm. Images 29 b and
c in particular are dominated by consolidated ice, probably pancake ice.
In addition, a comparison of Figure 28 b and Figure 29 a suggests that
between March 29 and April 1 there was substantial pancake production at
the ice edge.
|
|
|
|
|
|
|
|
|
|
|
|
|
|
|
|
|
|
|
|
|
|
|
|
|
|
|
|
Figure 28. ERS-1 SAR images from (a) March 19 and (b) March 29. The images on the left indicate bands (dark areas) of pancake and frazil ice. The images on the right, collected 10 days later and adjacent to those on the left, indicate that the pancake and frazil ice has moved eastwards and become more compact.

(c)

Figure 29. ERS-1 SAR images collected from within and during the
first major advance of Odden. (a) April 1, when Odden was still growing,
(b) April 4, the day after the aerial cover of Odden peaked, and (c) April
7, when Odden was receding. The frames within each image cover approximately
the same area at different times, thus permitting the monitoring of SAR
backscatter values over time and discussed in the text. In general the
images are thought to contain consolidated pancake ice, with relatively
ice-free areas in (a), top and bottom right corners, and (b), bottom centre.
Mean backscatter coefficients from the rectangular areas rose from -10.5
dB on April 1 to -8.2 dB on April 4 and April 7. This indicates that the
ice became more rough over that period.
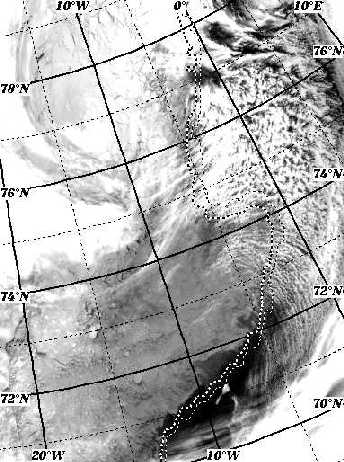

960401
960403
960405
960407
Figure 30. 4 NOAA AVHRR thermal infrared images of the Odden development in late March and early April, 1996. The dates are April 1 (upper left), April 3 (upper right), April 5 (lower left) and April 7 (lower right). Black/white contours are 30% and 70% total ice concentration from SSM/I.