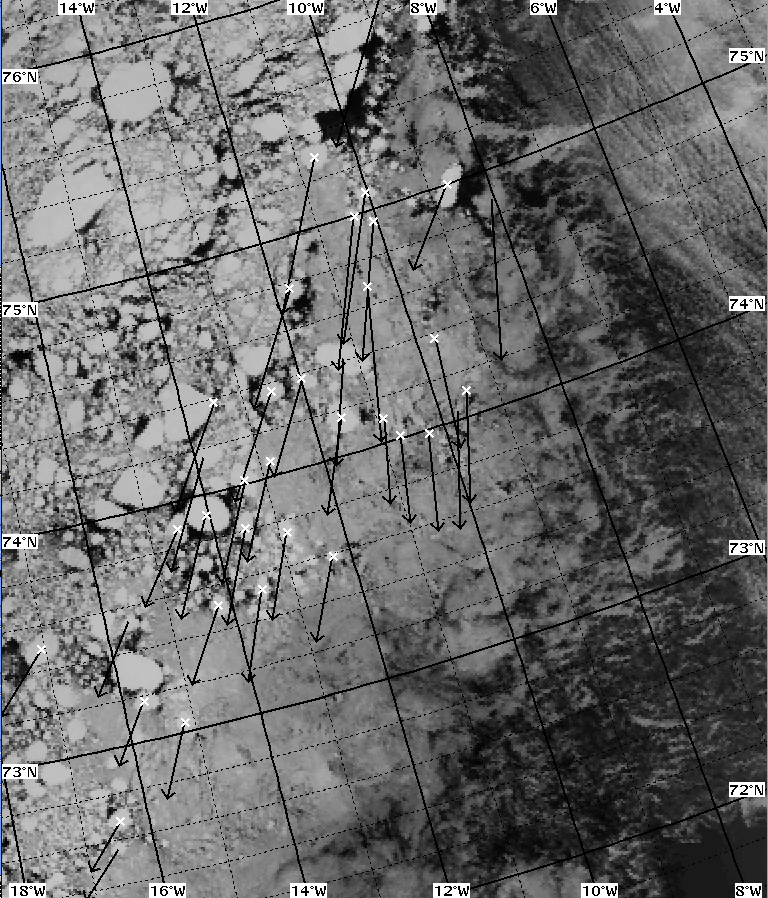
Ice drift analysis was carried out to determine what proportion of the Odden advance in late April consisted of advected multiyear ice. As the Odden region was relatively cloud free from April 25 to May 14 this permitted excellent coverage of the movement of sea ice using near infra red (channel 2) advanced very high resolution radiometer (AVHRR) images. In addition, all-weather ERS-1 synthetic aperture radar (SAR) images were analysed from the East Greenland Current (EGC) just north of the Odden ice tongue.
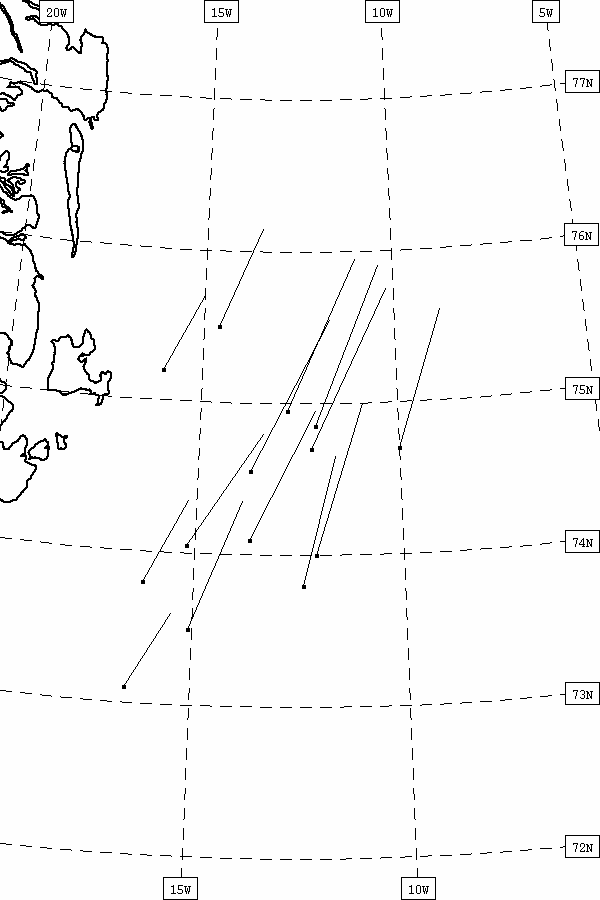
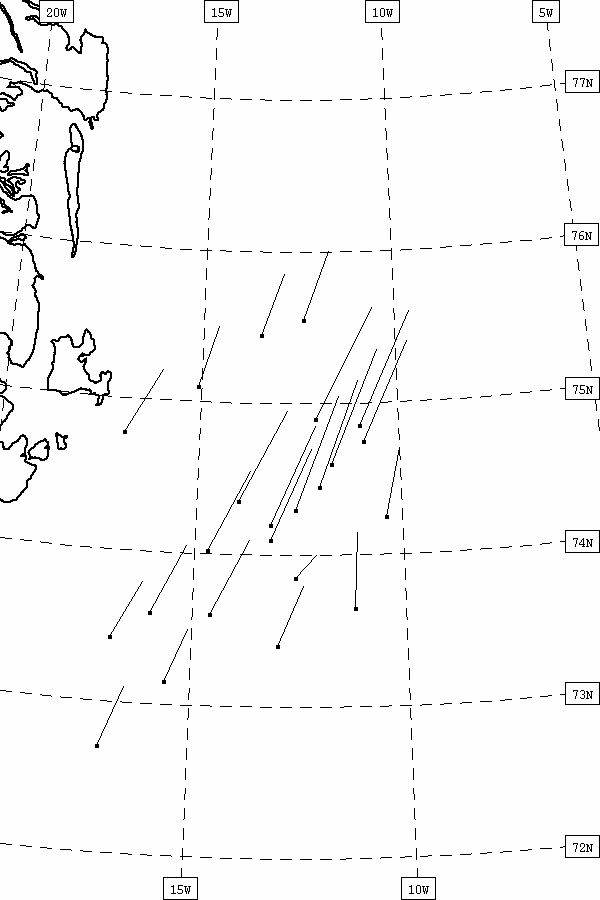
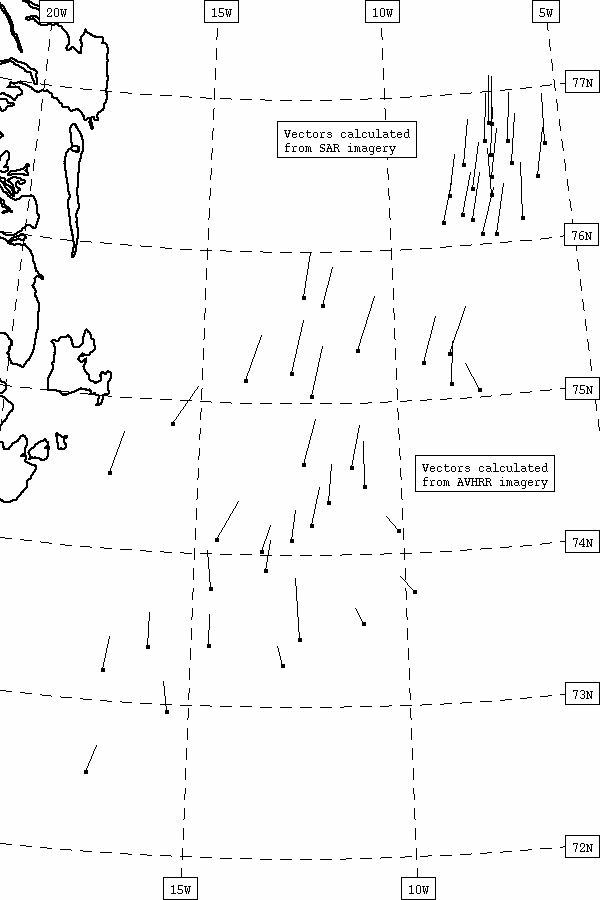
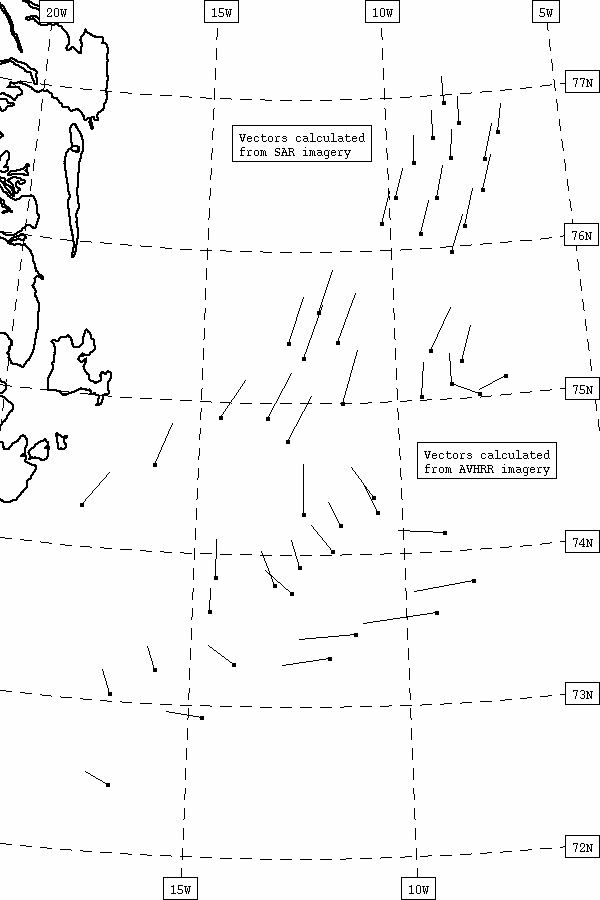
Figure 24 shows the ice motion vectors for up to 36 floes in the Odden region for six periods during April 25 to May 14. During the first two periods, April 25 - May 1 (Figure 24a) and May 1-5 (Figure 24 b), nearly all floes were moving in a SSW direction. During May 5-8 (Figure 24c) all the floes at the southeast edge of Odden had started moving in a south-easterly direction. Table 1 shows that even the floes in the East Greenland Current had begun moving in a more easterly direction, from 203 to 189 between May 1-5 and May 5-8. The SAR imagery vectors at the top of Figure 24c show that the floes in the East Greenland Current further north moved very consistently, from a southerly direction at 77N to SSW at 76N.
It was on May 8 that the aerial coverage of this Odden expansion reached
a maximum (Figure 2 and Figure 6). It was not until after the Odden had
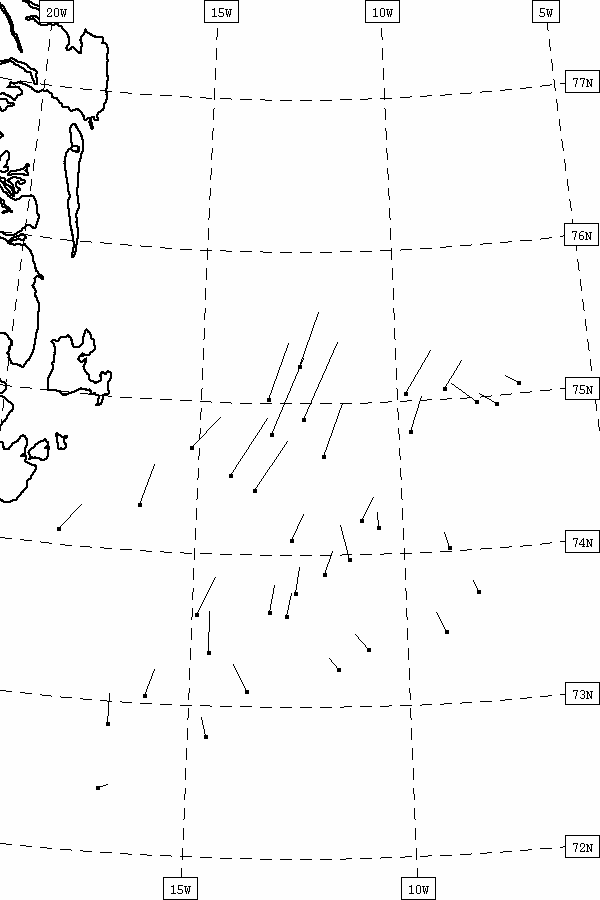
reached its maximum that some of the floes (multiyear ice) began advecting
eastwards (Figure 24d). This would indicate that the growth of the Odden
to its maximum size during April 25 - May 8 included little or no west-east
advection of the multiyear ice floes. The SAR imagery vectors at 76-77N
are almost identical to the period before (Figure 24 c), showing that at
this latitude the ice was not influenced by an easterly component. By April
11-14 (Figure 24e) the general flow direction at the southeast edge varied
from easterly to south-easterly. Thus, the west-east advection of the multiyear
floes was for only a few days at most. Figure 24f contains a composite
and clearly illustrates how the vector directions changed over the period
May 5-14. Table 1 summarises the vector data for the floes in Figure 24.
Groups 1, 2 and 3 contain only the floes that could be identified in all
the AVHRR images used, i.e. that are represented in each of Figure 24 a,
b, c, d and e. Group 1 comprises two floes relatively close to Greenland
and unaffected by the west-east component; group 2 consists of six floes
from the central East Greenland Current; group 3 is six floes close to
the Southeast edge of the ice pack; and group 4 consists of the floes from
the SAR images at 76-77N.
| Period |
|
|
|
|
||||
|
|
|
|
|
|
|
|
|
|
| April 25 - May 1 |
|
|
|
|
|
|
||
| May 1-5 |
|
|
|
|
|
|
||
| May 5-8 |
|
|
|
|
|
|
|
|
| May 8-11 |
|
|
|
|
|
|
|
|
| May 11-14 |
|
|
|
|
|
|
||
Table 1. Summary of floe motion vectors.
Speed in cm/s Dir. = Direction in degrees (90 is towards east, 180
is towards the south)
Group 1 - Two floes close to Greenland, Group 2 - Six floes in central
East Greenland Current, Group 3 - Six floes at southeast edge of pack ice,
Group 4 - All floes from SAR images, 15 for May 5-8, 14 for May 8-11
Figures 23-25 show cases which we have succeeded in analysing, where ice drift can be computed from successive AVHRR and/or ERS SAR images spaced a small number of days apart. We see that during the period April 28 -May 5 the ice is advecting downstream in the EGC with no evidence of eastward advection into the Odden region. On May 8-10, however, an easterly drift occurs in the range 72-74N, which appears to correspond to a decrease in Odden area, indicating that ice is being advected eastward out of the Odden into warmer water where it melts.
Figure 23. Ice drift April 28 to May 1 1996 overlaid on AVHRR image
of April 28.
Ice drift from NOAA AVHRR, April 25 to May 1, 1996
Ice drift from NOAA AVHRR, May 1-5, 1996
Ice drift from NOAA AVHRR, May 8-11, 1996
Ice drift from NOAA AVHRR, May 11-14, 1996
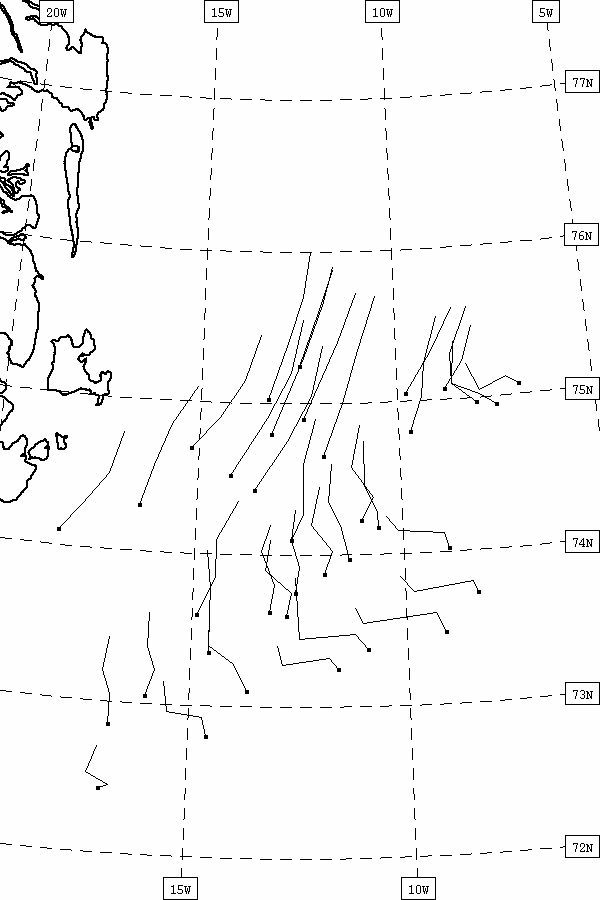
Figure 24. Series of diagrams constructed using AVHRR images, and for c. and d. ERS-1 SAR, showing ice motion vectors in the East Greenland Current and Odden. The dots represent the floe position at the end of each period. a. April 25 - May 1, b. May 1 - 5, c. May 5 - 8, d. May 8 - 11, e. May 11 - 14, f. Composite of May 5 - 8, May 8 - 11 and May 11 - 14.
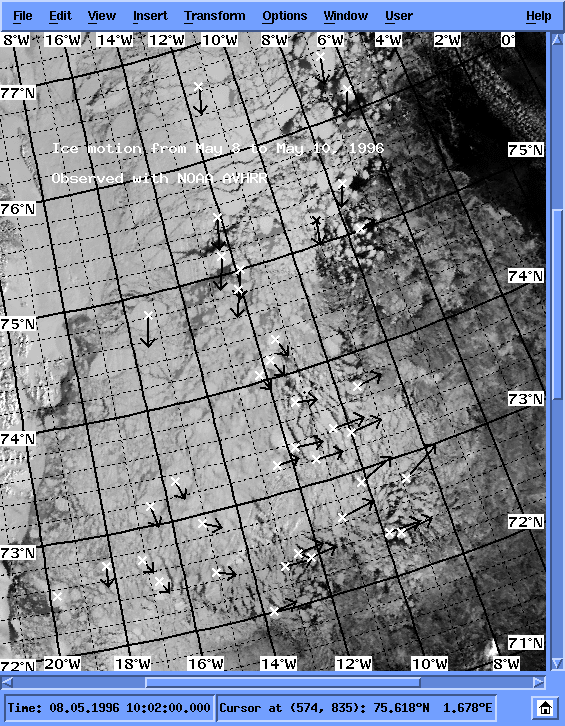
Figure 25. Ice drift derived from AVHRR images of May 8 to May 10, 1996. The vectors show actual ice displacement over the 2 day period, overlayed on the AVHRR image of May 8.
From the ice drift observations in late April and early May it is evident that advection of ice was not sufficient to explain the expansion of 130.000 square kilometres within the box being studied. Also, it seems that the ice motion in the Greenland Sea is strongly correlated with the local wind field. In order to investigate this further, we calculated cumulative drift of an artificial piece of ice driven entirely by the observed wind field at Jan Mayen. As a drag coefficient we used 3.0x10⁻³ which is representative of multi-year ice in the Greenland Sea (McPhee, 1990).

Figure 26a. Estimated wind driven ice motion using surface wind data from Jan Mayen and a drag coefficient of 3*10-3. Both x- and y-axis are kilometres of drift. Months January, March, May, July are dravn with lighter shade.
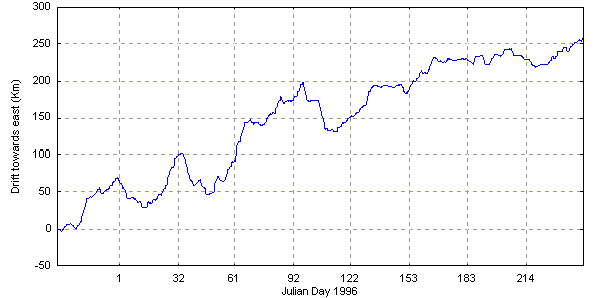
Figure 26b. Accumulated west-east component of estimated ice drift using same data as for previous figure. x-axis is Julian day of 1996, y-axis is in kilometres. Eastward drift is positive.
Figures 26a and 26b show that ice drift in the long term may cause ice advection into the Greenland Sea/Odden area, but that ice advection caused by wind alone cannot explain the rapid advance of the ice in early May. Note that the observed drift pattern of floes in the Greenland Sea corresponds very well to the estimated pattern for the period May 1-May 14, indicating that the drift pattern is primarily wind driven.
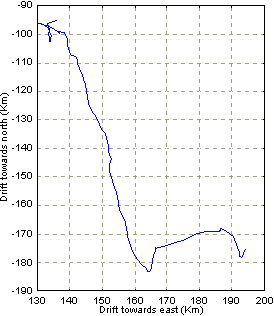

Figure 27 compares the calculated wind driven ice drift with the observed drift of 3 selected floes on the edge of the EGC. Note that the real floes drift much further to the south and west than the calculated drift. This is the effect of the EGC carrying the floes in that direction.